Health
Public Health
Tracking disease trends to allocate medical resources.
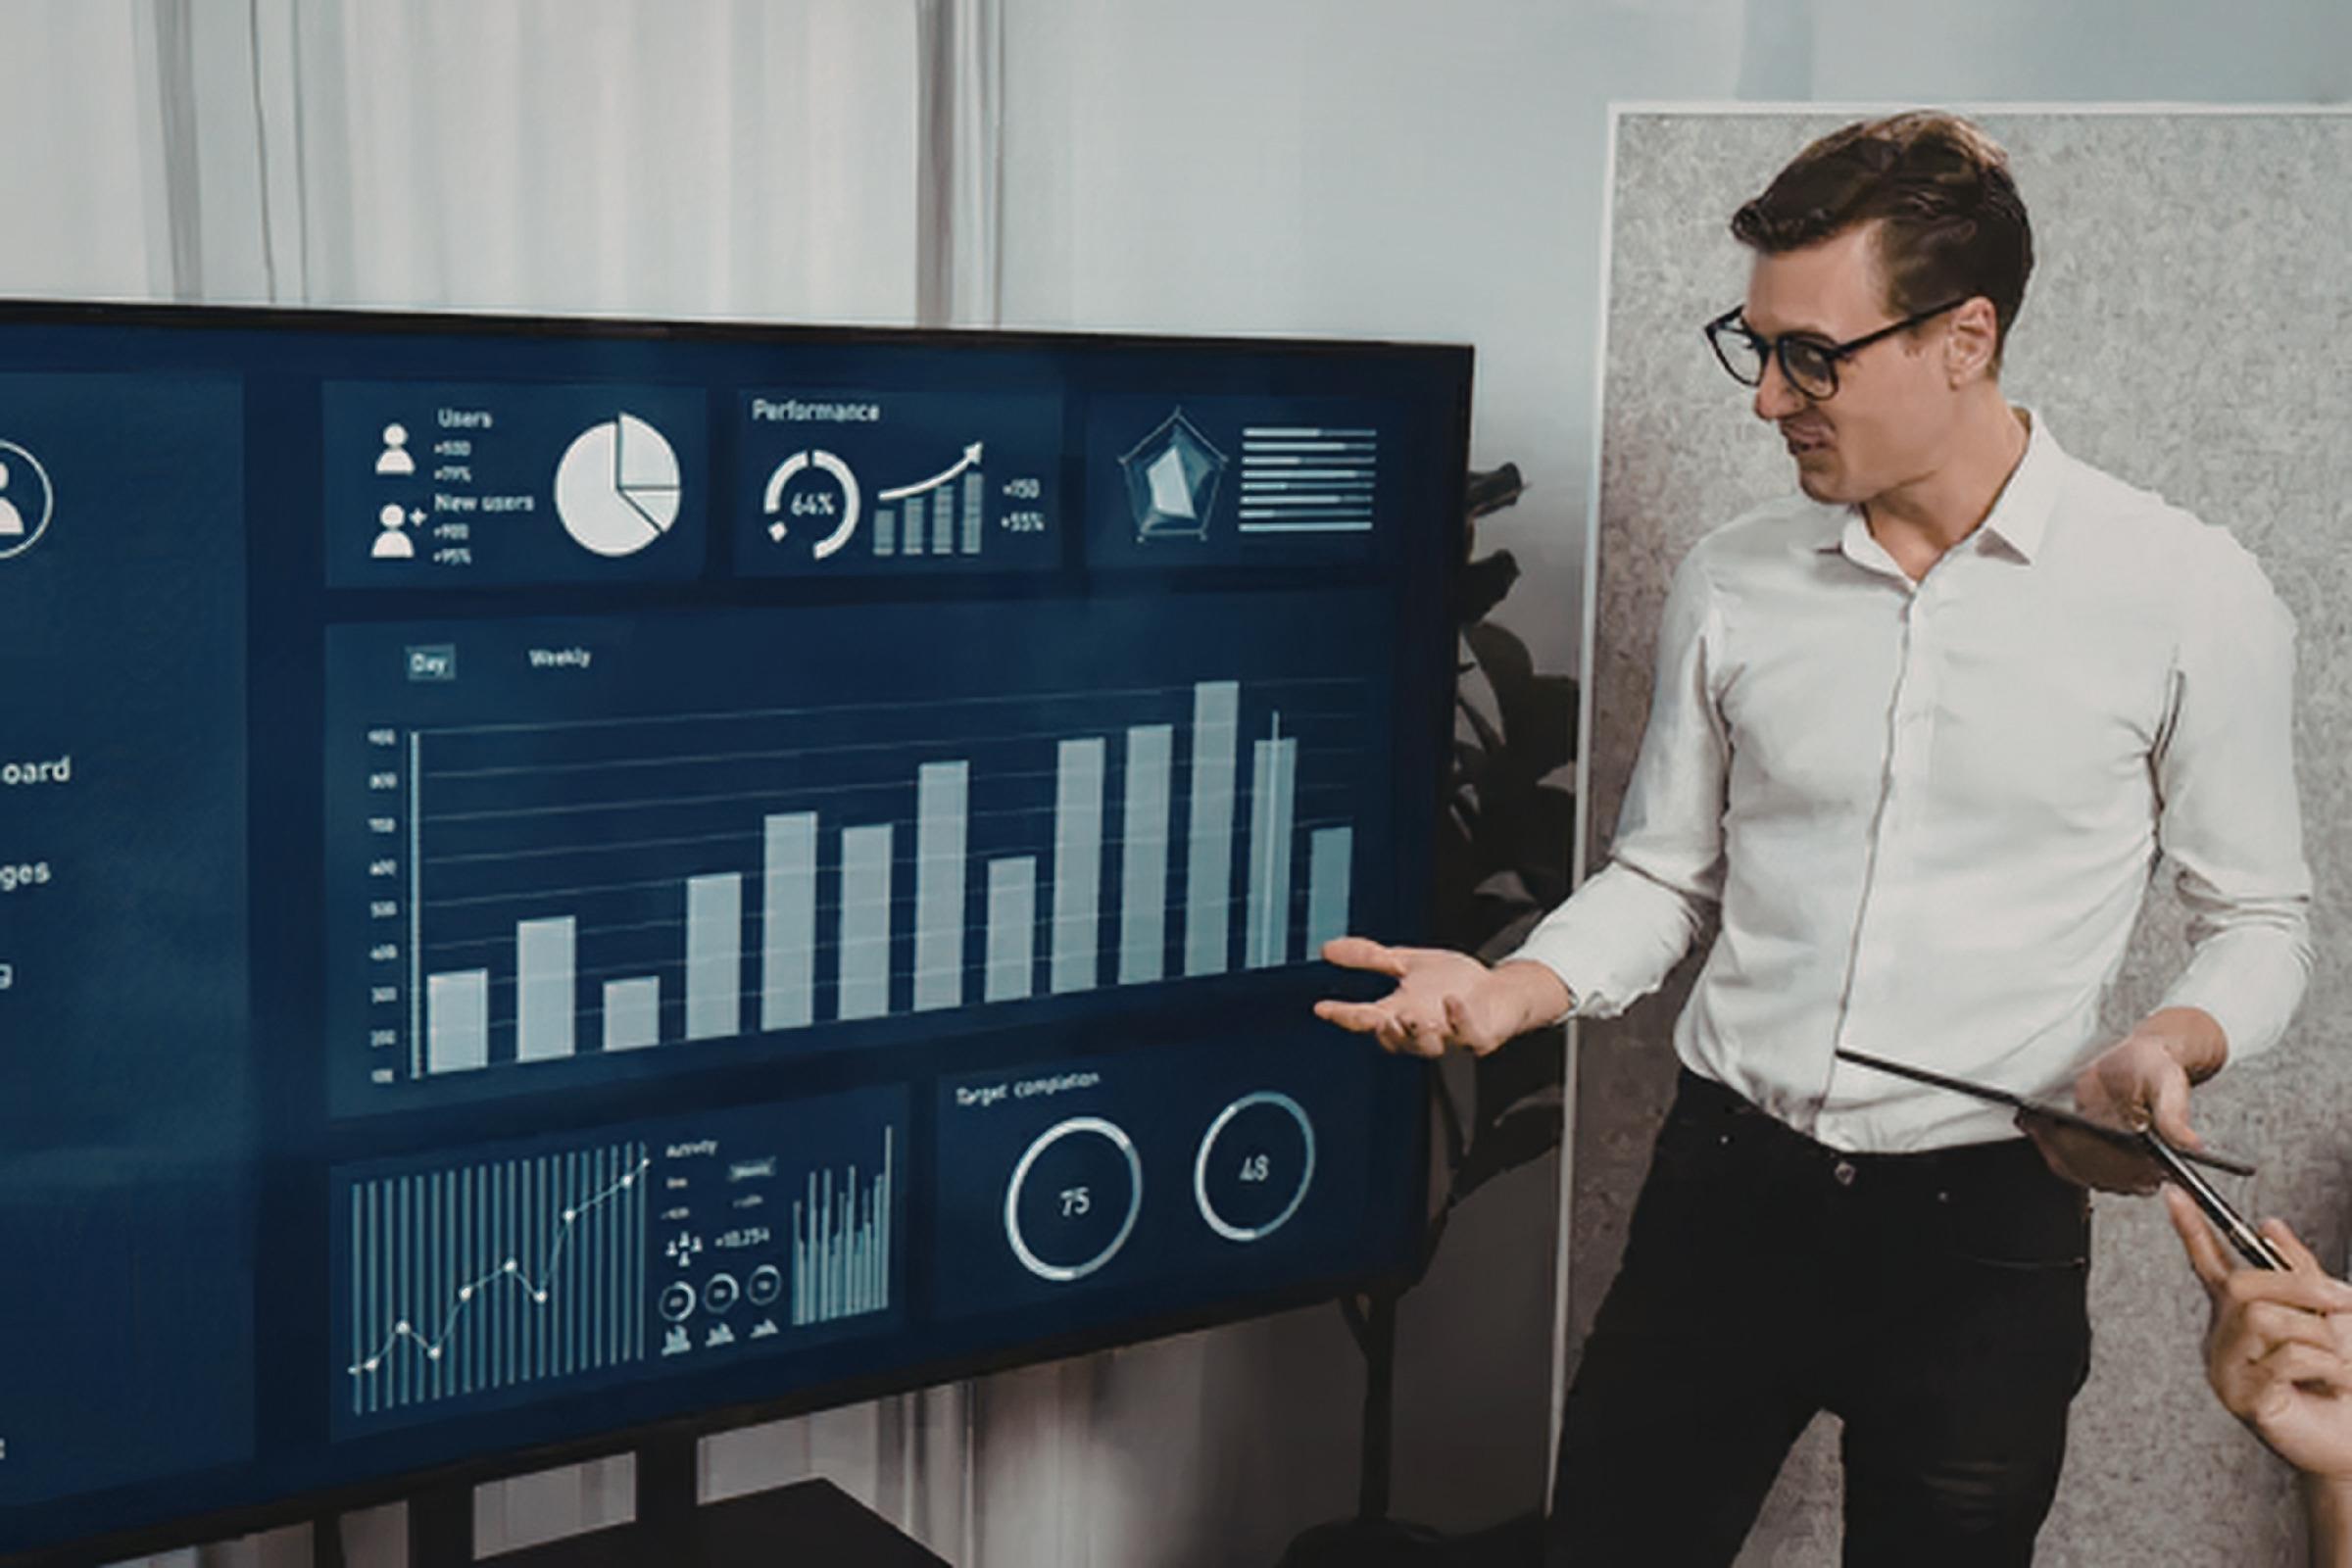
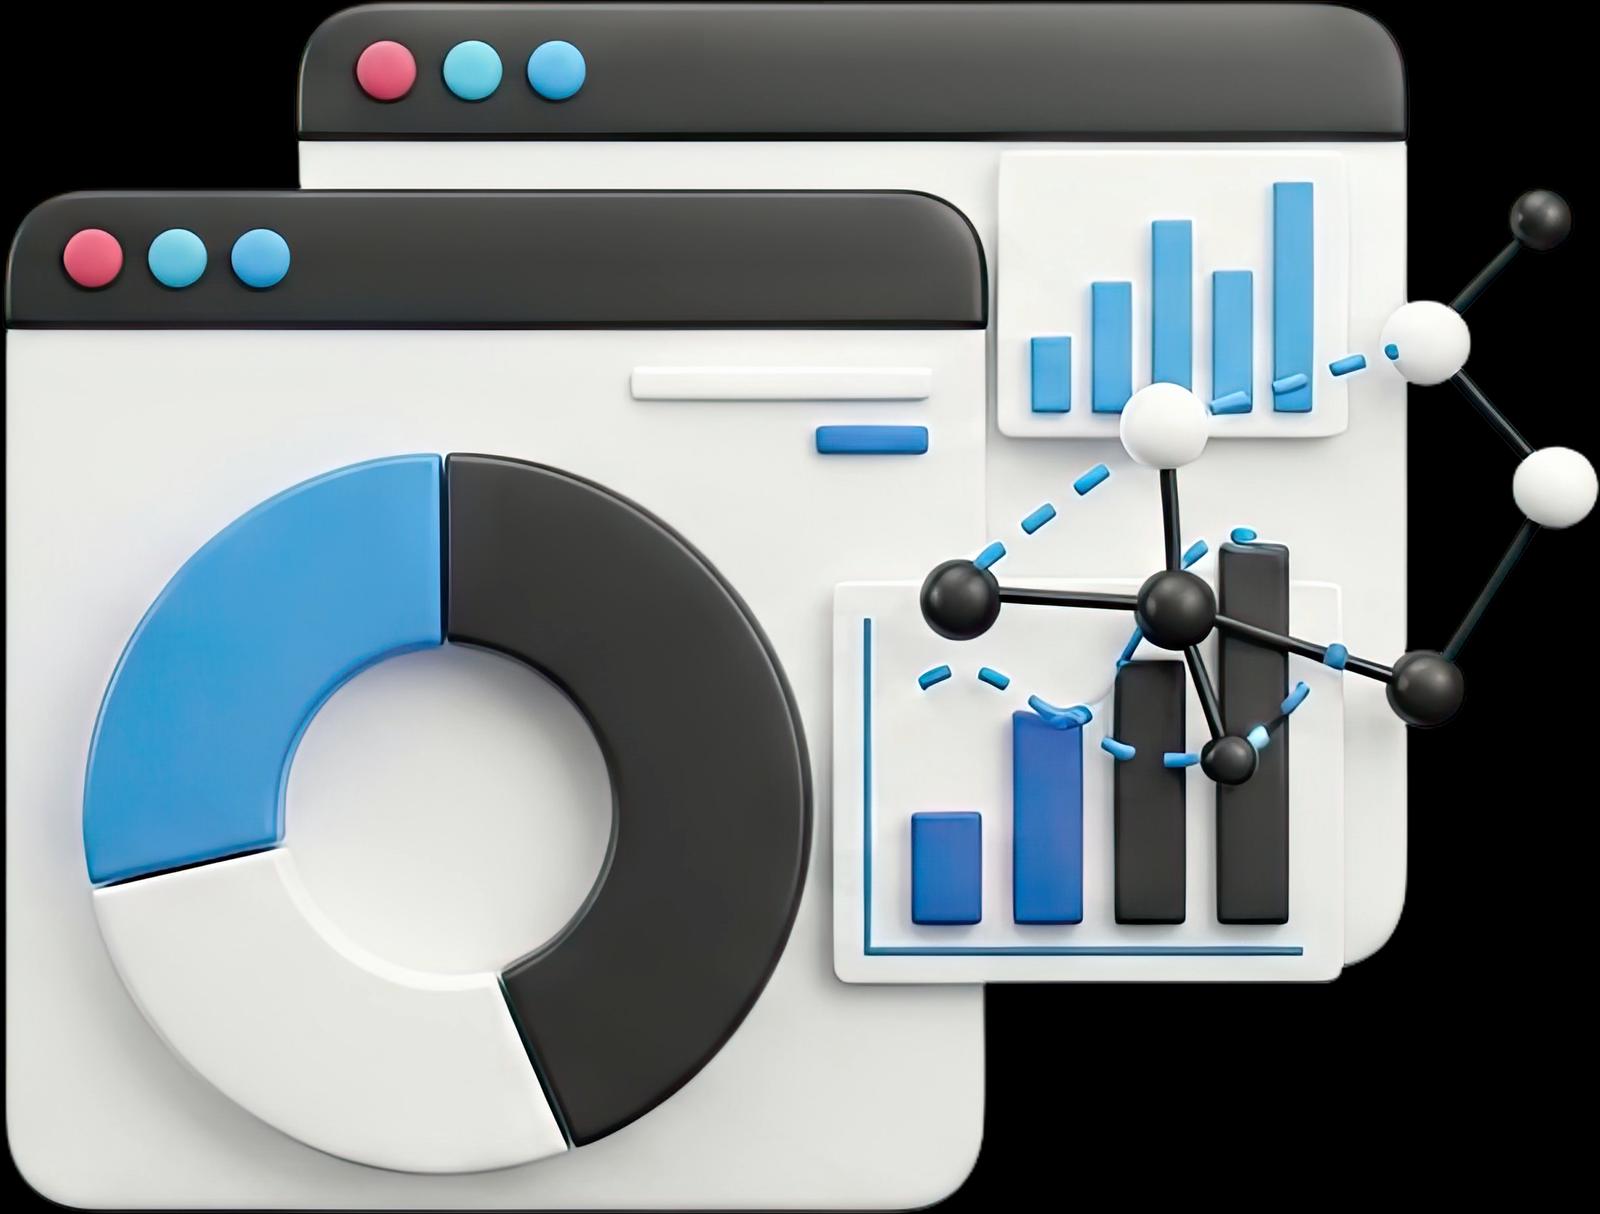
Data analysis transforms raw datasets into visual insights using tools like Tableau to explore relationships between dimensions and measures. Analysts employ techniques such as data blending to combine different sources and clustering to identify significant patterns or "hotspots" within the data.
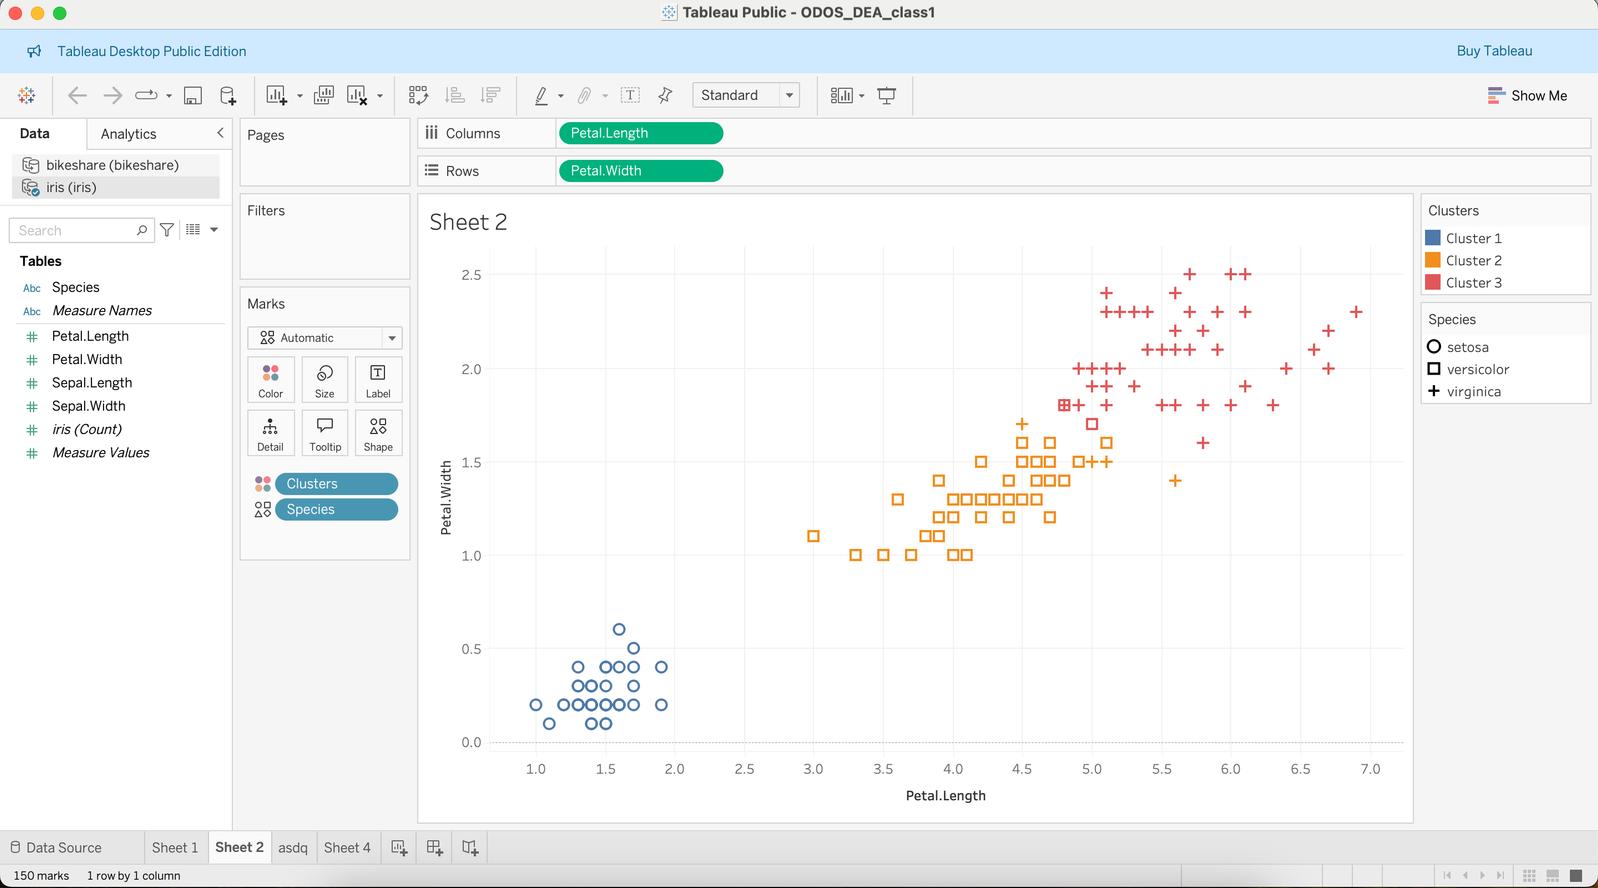
Interface example
Data analysis and insight extraction through Tableau's interactive dashboards, showcasing how dimensions and measures can be blended and clustered to reveal patterns in complex datasets.
Example use cases
Health
Tracking disease trends to allocate medical resources.

Justice
Identifying "hot zones" via historical threat data.
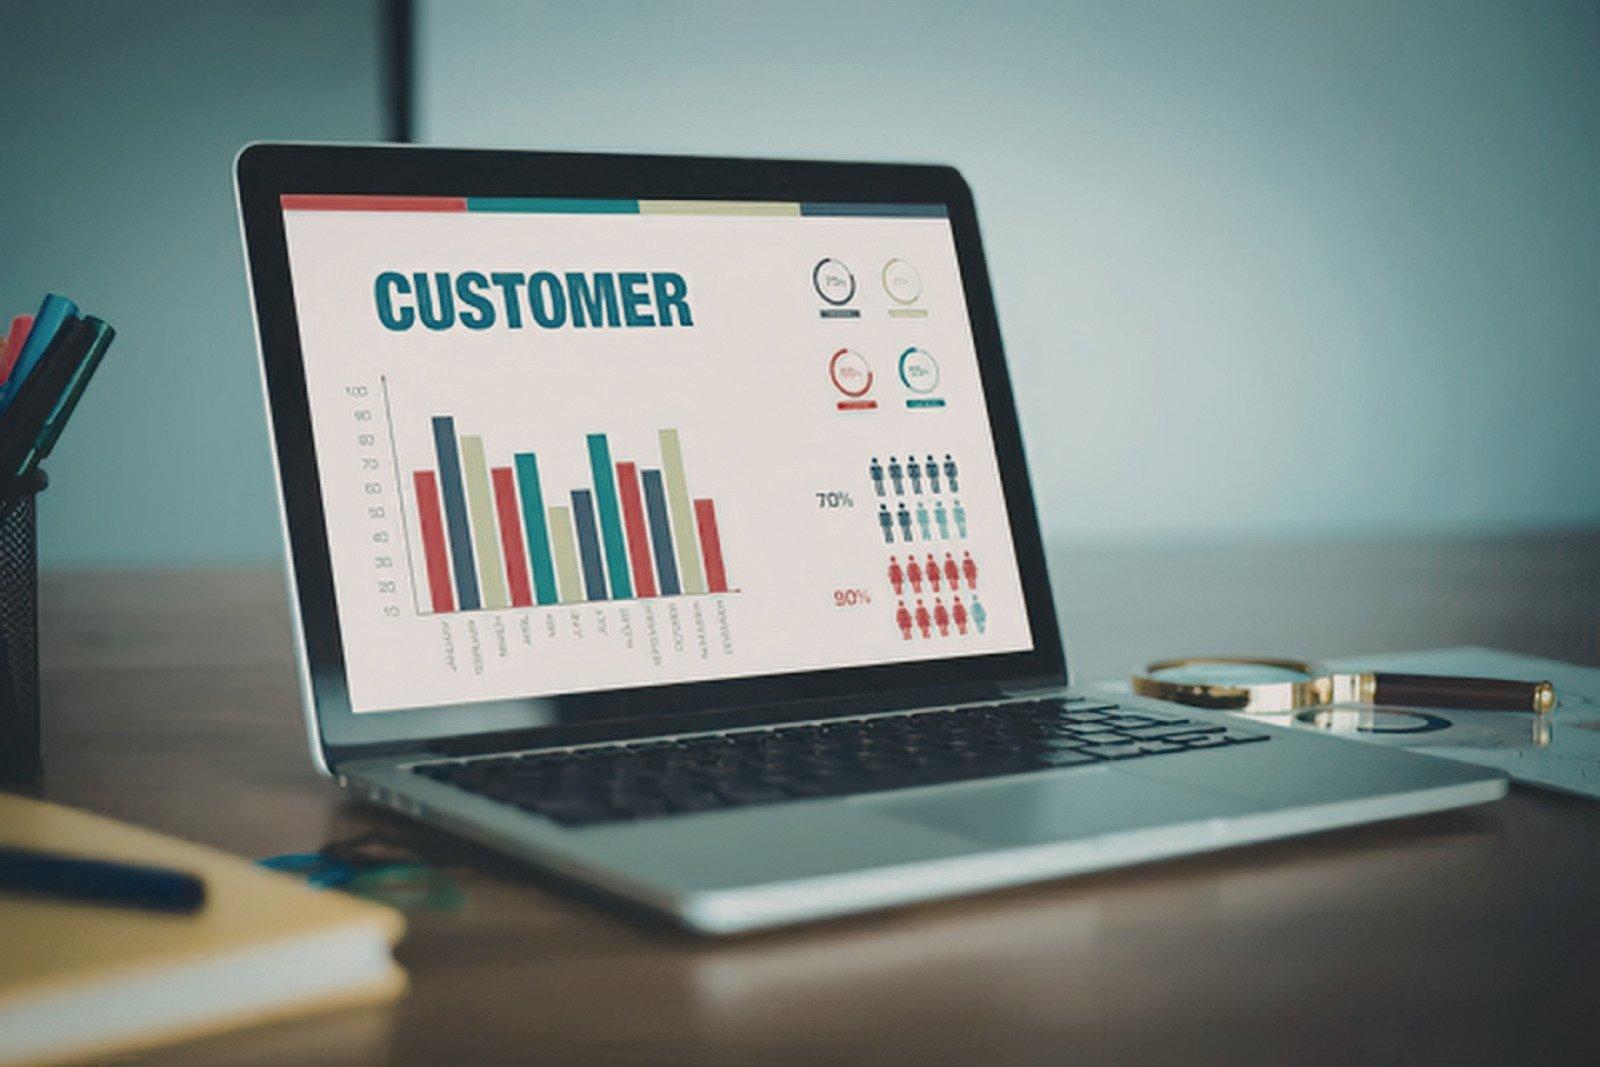
Commerce
Analyzing buying patterns to optimize retail stock.

We act as the "connective tissue" between different government agencies. Our system takes messy, scattered data—like satellite fire images and wind speeds—and combines them to show the big picture. For example, if a fire is detected, the system instantly calculates exactly which neighborhoods will be hit by the smoke.
Bibliography · Data Analysis